Disk IO: EC2 vs Mosso vs Linode
Recently I read an interesting idea on amazon EC2 forum about Raid0 strip on EBS to improve disk access performance. So I am very curious to know whether this idea actually works. Technically it is also possible to setup a raid system on Linode(referral link) as well, but it will be backed by same hardware (so I didn’t test this idea).
In this test I used bonnie++ 1.03e with direct IO support. These 3 VPS have slightly different configure. Mosso server has 256MB ram with 2.6.24 kernel and 4 AMD virtual cores. Lindoe vps has 360MB ram with custom built 2.6.29 kernel and 4 intel virtual cores. EC2 high-cpu medium instance has 1.7GB ram with 2.6.21 kernel and 2 intel virtual cores.
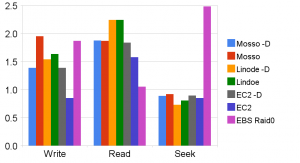
Here is the raw test result. On each VPS I run bonnie++ 3 times, then use median of 3 tests as the final result. The summary result is unweighted average value of different columns. Due to the memory size difference, I used different test file size. The EBS I used here is 4×10GB raid0.
In this table, -D means that test run with Direct IO option. The best results are highlighted. Direct IO test on EBS taking forever, so I didn’t finish that test.
|
. |
Write (MB/s) | Read (MB/s) | Seek (#/s) | |
|
. |
Mosso -D | 32.4 | 52.9 | 219 |
|
. |
Mosso | 56.9 | 52.6 | 225 |
|
. |
Linode -D | 37.7 | 76 | 187 |
|
. |
Lindoe | 41.5 | 76.1 | 201 |
|
. |
EC2 -D | 32.4 | 50.7 | 220 |
|
. |
EC2 | 18.9 | 39.2 | 210 |
|
. |
EBS Raid0 | 52.4 | 23.1 | 1076 |
In this chart, I used logarithm scales and shifted origin in order to show the relative difference between them. So the column value does not reflect the real test results. Higher value is better.
Conclusions: There is no clear winner in this test. Each VPS has the their high score in different category. Only one thing is clear, O_Direct does not work very well on EBS. Due to the nature of VPS, the Disk IO test is very unreliable. The performance I show here is not repeatable and may not reflect the true disk performance.

I’d be interested to see how this compares to performance on non-virtual server hardware.
@Jon Topper
These numbers are very close to performance of a single commodity hard driver. EBS’s IOps is close to a small size highy quality disk array. With a real high quality array, these number can be easily doubled or trippled.
What were the numbers for a regular EBS (non-raided)? Or is that EC2 result on EBS?
@Peter
I didn’t test regular EBS.
I think linode is the best option for VPSs, but the second best is Mosso. Disk I/O are OK on both. EC2 is good, but too expensive, only for companies, start-ups, etc. By the way, I played around with your yyang nginx AMI for a few minutes the other day, works OK but I prefer to install everything by myself on a naked default Ubuntu install.
Unfortunately these numbers don’t really mean much. Aside from what else is happening on the machines on website hosting, in some cases note that writing was showing up faster than reading, which really means that it’s just writing things to disk buffers. For this test to have been meaningful there should have been an fsync at the end of the run. The direct-i/o measurements should be closer to apples-to-apples.
When I’m doing I/O benchmarking I start every run with a clean reboot and follow an exact set of steps from bootup to start of the benchmark. It’s almost impossible to simulate that on a VPS.
thanks a lot for posting the chart here.
What about diminishing disk I/O as the VMs are more utilised? Are these tests not only approriate to that moment in time? Apples to apples, I agree with James and we are going to see a few virtual infrastructure providers caught out by disk trashing slowing up their client appliances.
I wonder what the EC2 VM to real ratio?
That is very helpful for every one who use non-virtual server hardware.
cisco course